Repository navigation
Netdata causing load average increase every ~20 minutes #5234
Description
Bug report summary
I noticed on two of my servers that the load average was increasing approximately every 20 minutes:

I suspected a cronjob, but I don't have any cronjobs that run every 20 mins. However, CPU usage doesn't actually increase during that period:
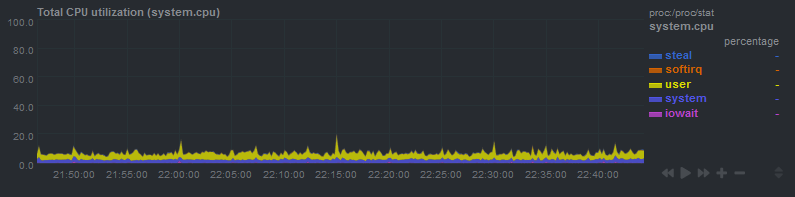
I did some digging and it took a long time to work out what was happening.
Linux updates the load average every 5 seconds. In fact, it actually updates every 5 seconds plus one "tick"
#define LOAD_FREQ (5*HZ+1) /* 5 sec intervals */
 * The global load average is an exponentially decaying average of nr_running +
 * nr_uninterruptible.
 *
 * Once every LOAD_FREQ:
 *
 *   nr_active = 0;
 *   for_each_possible_cpu(cpu)
 *	nr_active += cpu_of(cpu)->nr_running + cpu_of(cpu)->nr_uninterruptible;
 *
 *   avenrun[n] = avenrun[0] * exp_n + nr_active * (1 - exp_n)
HZ is the kernel timer frequency, which is defined when compiling the kernel. On my system, it's 250:
% grep "CONFIG_HZ=" /boot/config-$(uname -r)
CONFIG_HZ=250
This means that every 5.004 seconds (5 + 1/250), Linux calculates the load average. It checks how many processes are actively running plus how many processes are in uninterruptable wait (eg. waiting for disk IO) states, and uses that to compute the load average, smoothing it exponentially over time.
Say you have a process that starts a bunch of subprocesses every second. For example, Netdata collecting data from some apps. Normally, the process will be very fast and won't overlap with the load average check, so everything is fine. However, every 1251 seconds (5.004 * 250), the load average update interval will be an exact multiple of one second (that is, 1251 is the least common multiple of 5.004 and 1). 1251 seconds is 20.85 minutes, which is exactly the interval I was seeing the load average increase. My educated guess here is that every 20.85 minutes, Linux is checking the load average at the exact time that several processes are being started and are in the queue to run.
I confirmed this by disabling netdata and manually watching the load average:
while true; do uptime; sleep 5; done
After 1.5 hours, I did not see any similar spikes. The spikes only occur when Netdata is running.
It turns out other people have hit similar issues in the past, albeit with different intervals. The following posts were extremely helpful:
- Investigation of regular high load on unused machines every 7 hours
- Understanding why the Linux loadavg rises every 7 hours
- Telegraf - high load average every 1h 45m
- Linux commit that changed load average calculation to be every 5 seconds + 1 tick, instead of exactly every 5 seconds
In the end, I'm not sure if I'd call this a bug, but perhaps netdata could implement some jitter so that it doesn't perform checks every one second exactly.
OS / Environment
Debian buster
Netdata version (ouput of netdata -V)
netdata v1.12.0-rc2-51-nightly
Component Name
N/A
Activity
cakrit commentedon Jan 21, 2019
I wrote a small script to calculate exactly when we would expect the same condition to occur based on the polling period and the kernel frequency. The results are here. It's impossible to replicate on my Manjaro which has
CONFIG_HZ=300, will try to see it on a VM that hasCONFIG_HZ=1000. Expected period to see the spike will be 16min, 40sec, for a poll period of 1sec.If anyone wants to redo the calculations to find the minimum period for a different frequency, the script it's this:
mfundul commentedon Jan 21, 2019
Well, if netdata really is doing CPU work the load average is kind of accurate. One idea is to scatter thread scheduling in netdata so that not everything wakes up at once.
Ferroin commentedon Jan 21, 2019
Confirmed that it's correlated to collection by netdata, I'm not seeing any such spikes on systems that have only a few collectors and almost nothing that triggers new process creation.
I think adding some jitter to the data collection probably is the best option here, though I really don't know what to suggest for the range of jitter.
cakrit commentedon Jan 21, 2019
A random jitter wouldn't help, it would make things worse. At least know the occurence is predictable and very well documented on the mackerel link @Daniel15 provided. Ideally, we would take the polling period and CONFIG_HZ and be able to predictably add a 1ms delay once every X sec, where X is the time window from one artificial spike to the next. The only other (simpler) alternative I can think of, is to sample twice before sending the information (sample, wait 1msec, sample again). Presumably, the two values would be significantly different only at these points, so we could throw away the artificially high value.
mfundul commentedon Jan 21, 2019
CONFIG_HZ hacks are only valid for linux. There is also the so called race-to-idle approach in doing things, meaning that you may even want the data collectors to run concurrently and quickly so as to improve the power efficiency of the system. I like the idea of sampling the load average twice though.
Daniel15 commentedon Jan 21, 2019
@cakrit You don't even need a script if you're using Google Sheets 😃. This is a mathematical concept called least common multiple, and Google Sheets has a function called
LCMto calculate it.Google Sheets' implementation only supports integers so you'd need to work in milliseconds:
will give you the
1251number I mentioned in my original post. The first1000is the Netdata polling period in milliseconds, the250is theCONFIG_HZvalue.I used this site when writing my original post: https://www.hackmath.net/en/calculator/least-common-multiple?input=5.004+1%0D%0A&submit=Calculate+LCM
Do you mean netdata's sampling of the load average? Linux only updates the load average once every five seconds, and spikes take a while to decay since it uses the previous load average as part of the computation for the current load average, so that wouldn't work. Once this "spike" happens, it can take 1-2 minutes for it to fully decay.
I guess one option is to modify the Linux kernel itself to sample the load average twice and avoid outliers, but that's likely outside the scope of what anyone in this issue wants to work on 😛
cakrit commentedon Jan 22, 2019
Of course @Daniel15, you're too kind, what I wrote was a bit idiotic. :-)
I updated the sheet to use LCM and you can just play with the inputs. Unfortunately LCM works only for integers, so you'll see that for freq 300Hz, the cycles are not exact, but the time still shows up as an integer.
It looks like anything we could do on the netdata side would be very involved. Unless someone can suggest an algorithm that predictably avoids this issue, my only suggestion would be to use CONFIG_HZ=300, which at least in theory wouldn't have a least common multiplier with integer polling periods. In practice there's always rounding, so you can't avoid it unless if you're explicitly introducing a delay at the right moment.
Regarding possibilities for such an algorithm, I don't know if
/proc/timer_listcan help at all, I don't know what I'm reading there.7 remaining items
paulkatsoulakis commentedon Feb 27, 2019
I am still not familiar enough with the implementation, but something that keeps around on my mind while i was digesting the feedback on this issue:
Given we are focusing on 1s measurements, adding random jitters across the collectors wouldn't risk messing up correlation using time for the various events across the different metrics? Shouldn't sampling across the different collectors be as close as possible?
andrewhenke commentedon Oct 3, 2020
I know this is an old issue, but since it is still open, and I am having the same issue now, currently in 2020, I thought it would be worthwhile to mention that I am having severe bottlenecking occur shortly before my server stops serving my website and subdomain-hosted websites for usually around an hour, due to netdata. I'm on ubuntu server 18.04. Has any additional progress been made in this issue, towards a potential workaround or patch? I'm using the latest version of netdata cloud, on the nightly build. Any help would be greatly appreciated, I'm a huge fan of Netdata, I would prefer to continue to use your tool, but if this issue keeps occurring I don't think I will be able to continue using it.
Daniel15 commentedon Oct 3, 2020
@XxLilBoPeepsxX This issue isn't about actual load caused by Netdata; rather it's about artificial load due to how Linux measures load average. If you're encountering actual issues due to Netdata then I'd suggest opening a separate issue, as it's unrelated to this one.
andrewhenke commentedon Oct 3, 2020
@Daniel15 will do, thank you, my apologies for commenting on the wrong issue
ilyam8 commentedon Aug 5, 2021
Closing this issue since it is a discussion and not a problem caused by Netdata.
@XxLilBoPeepsxX consider opening a new issue.
cyfdecyf commentedon Jan 17, 2022
I see exactly the same periodic load averge spike on servers with short workload spike every one second. This issue discussion helped a lot in finding out the root cause. Thanks a lot!
I confirmed this with two tests:
/proc/loadavgwith below 1 second interval, use the forth field to get runnable and total kernel scheduling entities.CONFIG_HZto a different value and see if the period of load average spike changes as expected.I'm commenting this issue because I see periodic network latency spikes today. This remides me that there are other kinds of peoridic spikes that maybe caused by sample point shift or spike point shift. With 1 second interval of metrics, for short work load spike within 1 second, if the spike time point shifts within 1 second, I'm going to see this periodic spike.
One second metric interval is great, but still not enough if the spike is much less than one second.